Everyone in the world is waiting for the biggest sales campaigns of the year and speaking about two things.
- Are discounts going to be real?
- Who will have the best prices?
As we are saving ourselves for these days remembering the times when iPhones were sold for $45 hoping for something similar, others are discouraged by rumors about how retailers hike prices a few days before going on sale.
Needless to say, either you’re a consumer or business we couldn’t stay silent about this controversy anymore. It’s time to shed light on these two questions with the power of data.
In no more than a few weeks, we’re going to share our findings with you to shed light on this long-lasting mistery.
A quick peek to our methodology
Looking back to a 2-month (Aug 04 – Oct 12) Google Shopping Trend data, we have determined the best categories to collect prices on. This helped us see where the competition is the highest. Competition means more sellers and prices.
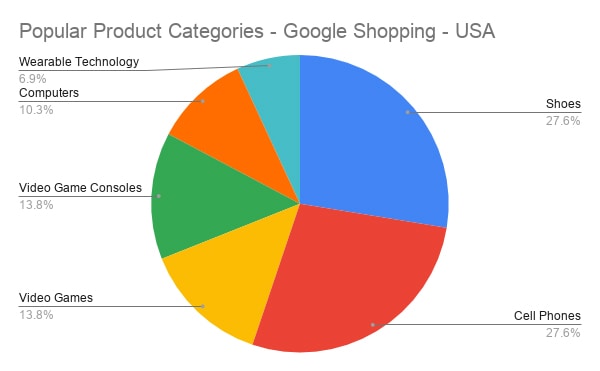
This method narrowed us down and helped pick 266/400 products from Amazon’s best sellers on the high competition categories except for shoes.
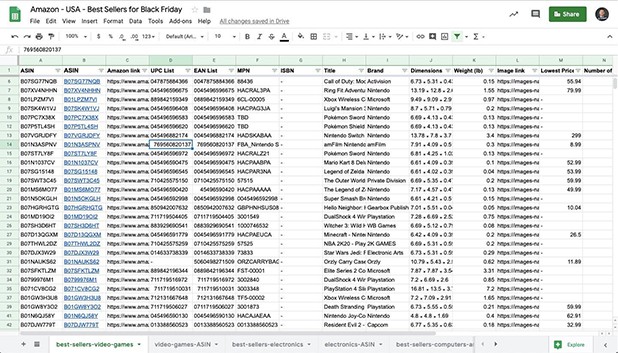
If you ask what happened to the rest of 134 products, they were either unavailable or exclusive to Amazon so we’ve left those out from the analysis just like any researcher would’ve done to set neutral grounds.
By the time we finish collecting the prices from October 29th to December 31st, 2019 there will be a total of 1,080,828 price changes happening in the USA’s e-commerce competitive pricing landscape according to our selected categories.
You heard that right.
1,080,828 price changes will be tracked until the end of this year!
Because we know that high competition leads to more than daily price changes we make sure we don’t miss anything by tracking those prices 4x/day.
But here comes the hard part.
Thanks to our brilliant developers and auto-matching engine from 266 products, 1571 sellers and 4289 matching prices were found in approximately 8 hours. This would’ve taken an approximate of 9 days* if we’ve tried to find these prices manually**.
For detecting price changes more accurately, we’re going to track 4289 prices 4x/day for 63 days. Btw, doing this manually would’ve taken more than 2 years***.
A preview of what we’ve collected and tracked so far
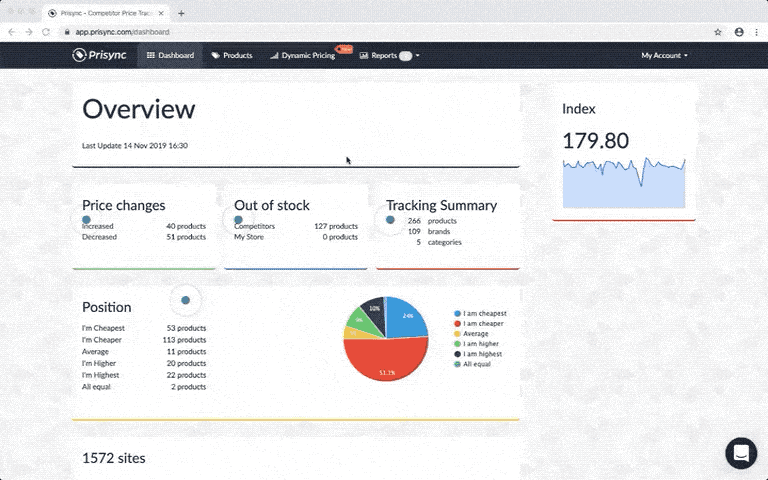
Below, there is our daily report converted into a Google Sheet.
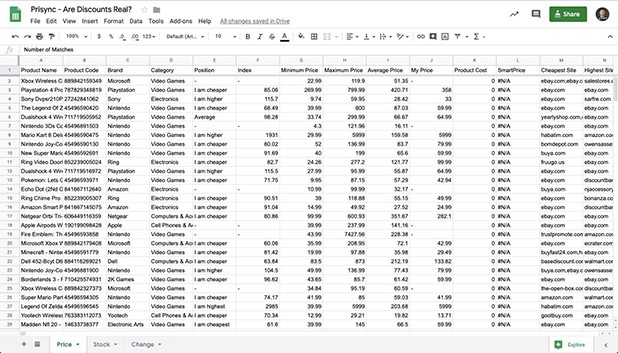
While we collect the data we’re observing which retailer is making its move to gain competitive advantage. So, in the following days let’s see what will actually happen before, during, and after BF/CM to see who changes prices when.
* It takes approximately 3 minutes to find a competitor product page for a certain product and record its price to a sheet. Multiply 3 minutes with 4289 prices and you’ll get 12,867 minutes. Divide that with 60 and you’ll get 214 hours and divide that to 24 you’ll get close to 9 days. This is a very optimistic approach because it idealizes finding a competitor without any roadblock or cognitive fatigue.
** Don’t try this by yourself or with your team members as it will permanently harm the nervous system of any human.
*** After having the competitor product page URLs it would take an average of 1 minute to open up a URL, copy the price, and enter the data in a spreadsheet.
Find out more about Prisync’s price tracking engine.
prisync research

Thanks for sharing this useful information! Hope that you will continue with the kind of stuff you are doing.